The Hidden Drain: How Micro-Idle Events Are Quietly Compounding Into Six-Figure Losses
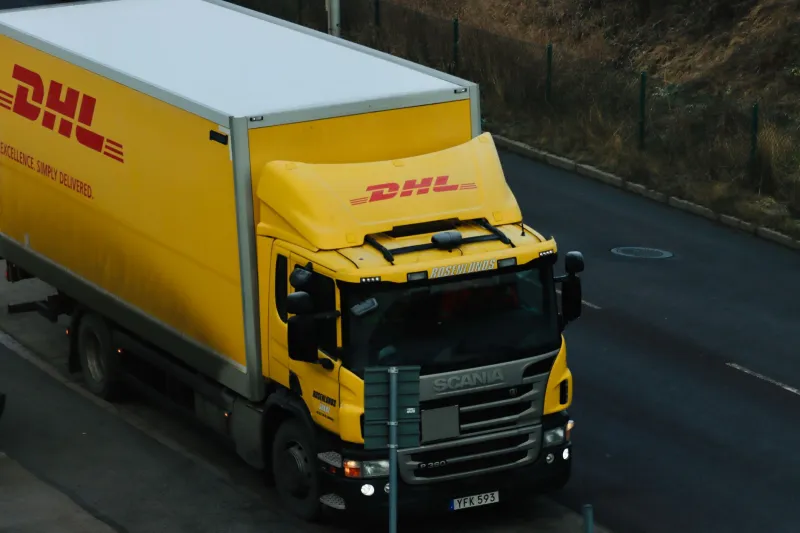
Ask a fleet manager about their idling problem and they will typically point to the obvious offenders: trucks left running during extended lunch breaks, vehicles idling in loading dock queues, drivers waiting with engines on during long customer appointments. These are the idling events that show up in standard reports, trigger alerts, and get addressed in driver coaching sessions.
What rarely gets addressed—because most platforms are not designed to surface it—is the idling that happens in the spaces between. The thirty-second engine-on pause at a red light sequence. The ninety-second wait while a driver confirms a delivery address. The three-minute idle during a shift handoff in a warehouse lot. Individually, each of these moments registers as noise. Across an entire fleet, across an entire operating year, they register as a serious financial problem.
Defining the Micro-Idle Problem
For the purposes of fleet analytics, micro-idling refers to engine-on, zero-movement events lasting between approximately thirty seconds and five minutes. This threshold sits below the trigger point of most standard idle alerts, which are typically configured to flag events of five minutes or longer. The logic behind that configuration is understandable—shorter events are difficult to act on in real time and easy to dismiss as operationally necessary.
The problem is not any individual micro-idle event. The problem is their frequency, their distribution across the fleet, and the degree to which they cluster into recognizable patterns that point to systemic inefficiencies rather than random operational variation.
A vehicle that micro-idles for an average of twelve minutes per delivery shift may appear to be performing adequately against standard benchmarks. Multiply that across forty vehicles operating five days a week, and the fleet is burning engine hours that translate directly into fuel consumption, accelerated engine wear, and avoidable carbon output—none of which appears in a conventional idle report.
Why Standard Reporting Misses It
Conventional fleet telematics platforms are built around threshold-based alerting. They are designed to catch the obvious: speeding events over a set limit, idle durations exceeding a defined window, trips that deviate significantly from assigned routes. This architecture is effective for managing known risk categories but structurally blind to pattern-level inefficiencies that accumulate below the threshold.
Micro-idle losses are a pattern problem, not an event problem. They require a different analytical approach—one that aggregates sub-threshold data across time, vehicles, routes, and operational contexts to identify where engine-on pauses are systematically clustering and why.
This is where granular real-time telematics data, combined with retrospective pattern analysis, delivers insight that event-based monitoring simply cannot. Rather than asking whether a specific idle event was too long, the analysis asks: at what points in the operational workflow does this fleet consistently generate brief idle accumulation, and what is the cumulative cost?
What the Data Reveals
Fleets that have applied granular idle analytics consistently surface the same finding: micro-idle accumulation is not random. It concentrates around specific operational transitions.
Last-mile delivery sequences are a primary source. Drivers approaching unfamiliar addresses, searching for parking, or waiting for access confirmation generate consistent clusters of brief idle events that are invisible in standard route efficiency metrics but significant in aggregate fuel consumption.
Traffic signal patterns on fixed routes create predictable idle accumulation points that, once identified, can often be addressed through minor route adjustments or departure time optimization. A route that regularly passes through a high-signal-density corridor during peak traffic hours may generate substantially more micro-idle accumulation than an alternative route that adds marginal mileage but reduces stop-and-start frequency.
Shift transition periods in depot and warehouse environments are another consistent source. Vehicles left running during driver changeovers, pre-trip inspections conducted with engines on, and informal idling during administrative tasks at the start and end of shifts contribute meaningfully to total idle hours without generating a single standard alert.
Loading and unloading sequences vary significantly by site. Facilities with efficient dock management generate minimal idle accumulation. Those with congested or poorly coordinated dock access create micro-idle clusters that repeat predictably every time a fleet vehicle visits that location.
Quantifying the Exposure
The fuel cost of idling in commercial diesel vehicles is well-documented. A typical heavy-duty truck burns approximately 0.8 gallons of diesel per hour at idle. For lighter commercial vehicles, the figure is lower but still material at scale.
Applying conservative assumptions to a mid-sized US fleet of fifty vehicles—each generating ten minutes of micro-idle accumulation per operating day across a 250-day operating year—produces approximately 2,083 idle hours annually. At current diesel prices, the direct fuel cost of that invisible idling sits in the range of $5,000 to $8,000 per year for the fleet. That figure alone may not seem alarming.
But the full cost picture is broader. Engine wear attributable to idle operation shortens maintenance intervals and accelerates component replacement timelines. For fleets operating under carbon reporting obligations or voluntary sustainability commitments, the emissions associated with undetected micro-idling create compliance exposure that is increasingly difficult to ignore as regulatory pressure on commercial transportation intensifies in the US.
For larger fleets—100 vehicles or more—the cumulative exposure scales proportionally, and the operational patterns driving the inefficiency tend to become more entrenched precisely because they have never been measured.
What Leading Fleets Are Doing Differently
The fleets that have made measurable progress on micro-idle reduction share a common analytical approach. They do not begin with driver coaching. They begin with data segmentation.
By isolating micro-idle accumulation by route, by time of day, by facility, and by driver, they can distinguish between idling that reflects driver behavior and idling that reflects operational environment. That distinction is critical. Coaching a driver to reduce idling at a dock where congestion makes engine-off impractical is ineffective and creates friction. Addressing the dock congestion itself—or adjusting the delivery schedule to avoid peak congestion windows—eliminates the idle accumulation structurally.
Several large US distribution fleets have reported annual fuel savings in the range of $150,000 to $400,000 after implementing granular idle analytics programs, with the majority of gains coming not from driver behavior change but from route and scheduling optimization informed by pattern-level data.
The Measurement Imperative
Micro-idling will continue to be an invisible cost center for any fleet whose telematics platform is not configured to capture and aggregate sub-threshold engine-on events. The technology to surface this data exists. The analytical frameworks to interpret it at a pattern level are mature and deployable.
The question for fleet operators is straightforward: if your current platform cannot show you where your fleet's engine-on minutes are accumulating below the five-minute threshold, you are managing to an incomplete picture of your operating costs. And in a margin-sensitive industry, incomplete pictures have a compounding price.