Thirty Seconds to Profit: The Compounding Financial Power of Faster Fleet Decisions
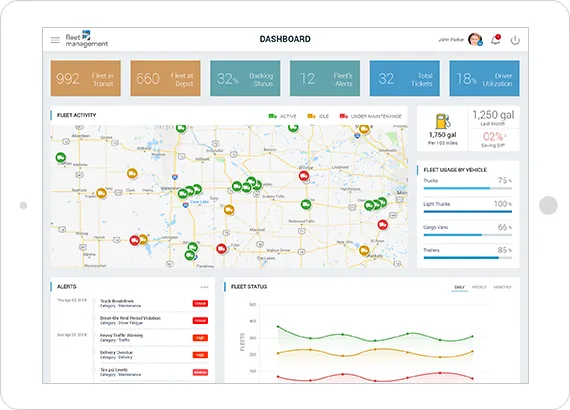
Photo: fleet dispatcher real-time routing dashboard traffic monitoring, via www.iotconnect.io
Fleet economics are often discussed at the macro level—annual fuel budgets, quarterly maintenance expenditures, year-over-year driver turnover rates. But some of the most consequential financial dynamics in fleet operations play out in intervals measured not in months or weeks, but in seconds.
Specifically: the seconds between when a routing disruption occurs and when a fleet manager acts on it.
This is not a theoretical observation. It is a measurable, compounding financial reality—one that the most analytically sophisticated US fleet operators have begun to quantify with considerable precision.
The Anatomy of a Routing Disruption
Consider a scenario that plays out hundreds of times daily across American logistics networks. A delivery vehicle is 40 minutes into its afternoon route when a traffic incident closes two lanes on a primary corridor in Atlanta. The GPS platform detects the developing congestion. A rerouting recommendation is generated.
In Fleet A, the operations manager receives the alert on a unified dashboard, evaluates the recommended alternate route, and approves the reroute within 30 seconds of the incident detection. The driver is redirected before the congestion materially affects travel time.
In Fleet B, the alert arrives in a separate system that the dispatcher checks every few minutes. By the time the reroute instruction reaches the driver—approximately five minutes after the initial detection—the vehicle is already embedded in the congestion. The alternate route now offers diminishing benefit. The driver loses 18 minutes.
Eighteen minutes. On a single vehicle. On a single afternoon.
Compounding Across Scale and Time
The financial significance of that 18-minute difference becomes apparent only when the scenario is multiplied across the actual scale of fleet operations.
A fleet operating 75 delivery vehicles, each completing an average of 12 route segments per day, encounters meaningful routing disruption events—traffic incidents, weather delays, sudden priority changes—on a statistically predictable basis. Conservative industry estimates suggest that between 8 and 12 percent of daily route segments involve at least one disruption event significant enough to warrant a routing adjustment.
For a 75-vehicle fleet, that translates to roughly 54 to 81 disruption events per day. If a five-minute response lag costs an average of 12 minutes of productive driving time per event (accounting for scenarios where the delay is partially avoidable), the fleet loses between 648 and 972 driver-minutes daily.
At an average fully-loaded driver cost of $38 per hour—accounting for wages, benefits, and associated overhead—that latency gap costs between $411 and $616 per day in pure labor terms. Annualized, the figure ranges from approximately $150,000 to $225,000.
And that is before accounting for fuel.
The Fuel Dimension
Vehicles caught in avoidable congestion are not merely consuming driver time. They are burning fuel at rates that bear no productive relationship to miles traveled. Stop-and-go traffic conditions can increase fuel consumption by 20 to 40 percent compared to free-flow driving, depending on vehicle type and load.
For a diesel delivery vehicle averaging 10 miles per gallon under normal conditions, a 15-minute congestion exposure that might have been avoided with a faster reroute decision can represent an additional 0.8 to 1.2 gallons of fuel consumed unnecessarily. At current US diesel prices, that is $3.20 to $4.80 per incident—a number that seems negligible until it is multiplied across 70 incidents daily and 250 operating days annually.
The arithmetic produces a fuel waste figure in the range of $56,000 to $84,000 per year for a fleet of this size, attributable specifically to decision latency rather than unavoidable traffic conditions.
The Customer Satisfaction Variable
The financial case for faster routing decisions extends beyond the direct cost lines of labor and fuel. Delivery performance—measured in on-time arrival rates and customer satisfaction scores—is increasingly a pricing and contract variable in US logistics markets.
A regional food service distributor operating across the Pacific Northwest restructured its real-time routing workflow in 2023, specifically reducing the average time between disruption detection and reroute execution from approximately six minutes to under 90 seconds. The operational change was architectural: routing alerts were elevated to primary dashboard status, and approval workflows were simplified to reduce the number of steps between alert and action.
Over the following two quarters, the company's on-time delivery rate improved by 6.2 percentage points. More meaningfully, three of the distributor's largest commercial accounts—which had contractual on-time performance thresholds—renewed at rates that management attributed in part to the demonstrated improvement. The annualized revenue protection value of those renewals exceeded $400,000.
The technology investment that enabled the improvement was not a new platform. It was a reconfiguration of how existing real-time data was surfaced and acted upon.
Speed of Insight Versus Volume of Data
This is the distinction that separates analytically mature fleet operations from those still accumulating data without extracting proportional value from it. Volume of data is not the constraint. Most modern fleet telematics platforms generate more positional, behavioral, and diagnostic data than any operations team can meaningfully process.
The constraint is speed of insight—the elapsed time between a relevant event occurring in the field and a decision-maker having the information necessary to respond to it effectively.
Fleet intelligence platforms that prioritize alert architecture, decision-support interfaces, and streamlined approval workflows are not solving a data problem. They are solving a human decision latency problem. And as the arithmetic above demonstrates, that is precisely where the compounding financial leverage lives.
What the Numbers Demand
For fleet operators evaluating their current routing and response capabilities, the relevant question is not whether their telematics platform is collecting accurate data. It almost certainly is. The question is how many seconds—or minutes—elapse between the moment that data becomes actionable and the moment a decision is made.
In a business where 30 seconds versus 5 minutes compounds across thousands of route events annually into six-figure cost differentials, that question deserves a precise, data-driven answer.